
Grok’s position in the AI market depends on which numbers you examine. Model leaderboards measure answer quality, token usage measures how much an AI system processes, and market-share reports estimate how widely a product is used. These metrics reveal different aspects of xAI’s progress and should not be treated as interchangeable.
As of October 2026, the latest available public data shows Grok competing in a crowded AI market.
On the Arena text leaderboard snapshot dated October 8, Grok 4.20 beta variants appeared at different positions, while separate traffic estimates placed Grok behind ChatGPT, Google Gemini, and Claude in standalone AI chatbot website visits.
xAI also provides API customers with tools to monitor token consumption and costs.
The important distinction is that a strong leaderboard position does not automatically translate into the largest user base or the highest token volume.
Here is what the available data tells us about Grok’s rankings, usage, and market position.
Grok Rankings Update: What Has Changed in 2026?
The Grok rankings update is best understood through three separate indicators: model quality, usage, and market reach.
- Model rankings: Arena evaluates AI responses through human preference comparisons across different tasks and categories.
- Token usage: xAI’s developer console allows customers to inspect their own API consumption by model, API key, and token type.
- Market share: Third-party analytics estimate Grok’s share of traffic to standalone AI chatbot websites, while company filings provide a different view of product adoption.
These indicators do not measure the same thing. A model can score well on a coding benchmark without having the most users. An assistant can attract substantial usage through a social platform without generating the most visits to its standalone website.
For that reason, the figures below are labeled by source, date, and measurement method wherever possible.
1. Where Does Grok Rank on AI Leaderboards?
AI leaderboards compare models using different evaluation methods. Some measure human preferences, while others test coding, mathematics, instruction following, factual accuracy, or specialized reasoning.
The Arena text leaderboard is useful because it compares models through user evaluations of competing responses. However, it is not a complete measure of every capability or of total market adoption.
i) Grok’s position on the October 2026 Arena leaderboard
Arena text leaderboard snapshot dated October 8, 2026, listed the following Grok models:
| Grok model | Arena text rank | Score | Votes |
|---|---|---|---|
| Grok 4.20 beta | 13 | 714 | 75 ± 527,928 |
| Grok 4.20 beta, reasoning variant | 45 | 1472 | ± 466,524 |
| Grok 4.20 beta, multi-agent variant | 46 | 1470 | ± 465,008 |
| Grok 4.5 | 51 | 1466 | ± 439,953 |
| Grok 4.1 Thinking | 52 | 1465 | ± 366,511 |
| Grok 4.1 | 60 | 1459 | ± 368,682 |
| Grok 4.7 xhigh | 90 | 1443 | ± 78,780 |
| Grok 4.3 | 93 | 1442 | ± 471,448 |
Source: Arena’s text leaderboard, October 8, 2026.
Rankings and scores can change as new evaluations are added.
These results illustrate why it is important to identify the exact model variant. A reasoning configuration and a standard configuration may perform differently, even when they belong to the same model family.
They also show why a model’s version number alone is not enough to predict its leaderboard position. In this snapshot, the Grok 4.20 beta1 entry ranked above the listed Grok 4.5 and Grok 4.7 xhigh entries.
That does not establish that Grok 4.20 is universally better.
The snapshot represents one text-ranking view, not every Arena category, coding evaluation, or real-world workload.
ii) What do Arena scores and votes mean?
Arena uses human preference evaluations in which users compare model responses. Its scores summarize the results of those comparisons, while vote counts indicate how many evaluations contributed to an entry.
The score’s uncertainty range matters. Two models with overlapping uncertainty ranges may not have a reliably established performance difference, even if one appears several positions higher.
A leaderboard should therefore be read as a comparative signal, not as a definitive ranking of every AI capability.
iii) Does Grok rank among the best AI models?
The answer depends on the specific Grok variant and task.
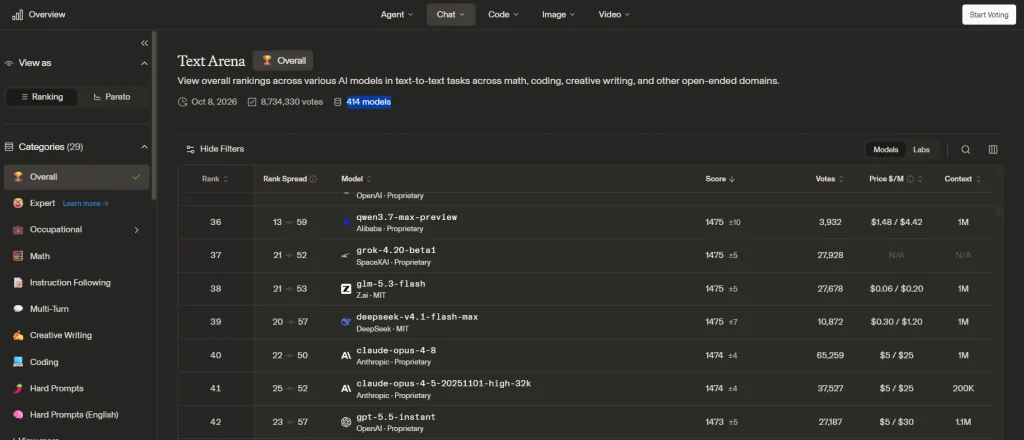
The October 11(screenshot) placed Grok 4.20 beta1 at rank 37 among 414 listed models. That is a meaningful competitive position, but it does not put that entry at the top of the overall text leaderboard.
For a coding workflow, a coding-specific evaluation may be more informative than the overall text ranking. For an assistant that handles images, a vision leaderboard may be more relevant.
Best practice: Compare the exact model versions on the benchmarks that reflect your intended use rather than relying on a single overall ranking.
2. What Does Token Usage Mean for Grok?
A token is a unit of text or other model input and output representation used by an AI system.
Tokens do not correspond exactly to words: a single word may contain multiple tokens, while punctuation, numbers, and parts of words can also be tokenized.
For developers using the xAI API, token usage matters because it can affect billing, capacity planning, and application performance.
1. Input tokens vs. output tokens
| Token type | What it measures | Example |
|---|---|---|
| Input tokens | Content sent to the model | User prompts, instructions, and conversation context |
| Output tokens | Content generated by the model | Answers, summaries, explanations, and code |
| Cached input tokens | Eligible input content reused through prompt caching | Repeated system instructions or recurring context |
| Tool-related costs | Charges associated with supported server-side tools, where applicable | A request that uses an additional tool |
The exact categories available for reporting and billing depend on the API feature and model.
A simple example illustrates the difference. Suppose an application sends a long set of instructions and a user’s question to Grok, then requests a detailed answer. The instructions and question contribute to input usage; the generated answer contributes to output usage.
If the application repeats the same instructions for thousands of requests, token consumption can accumulate quickly. Prompt caching, where supported and applicable, may reduce eligible input costs.
2. How can developers check Grok token usage?
xAI’s official Usage Explorer documentation explains how team administrators can inspect consumption in the xAI Console.
The documented controls include:
- Open the Usage Explorer in the xAI Console.
- Select a reporting period and time granularity.
- Choose a measurement such as cost, token count, or billing-item count.
- Group usage by dimensions such as API key or model.
- Apply filters to investigate particular models, keys, request IPs, clusters, or token types.
This helps developers distinguish a rise in total spending from a rise in the number of tokens processed.
It can also help identify which model or API key is responsible for a change in usage.
The console reports consumption associated with the account or team being inspected. It does not provide a public ranking of all Grok users or reveal xAI’s total token volume compared with OpenAI, Google, or Anthropic.
3. Does xAI publish Grok’s total token usage?
The public documentation describes ways for customers to monitor their own API usage. It does not, by itself, establish a verified, regularly updated total for all Grok tokens processed worldwide.
That distinction matters when reading claims about Grok’s growth. An increase in tokens processed by one customer, one API key, or one model is not proof that Grok has gained a particular percentage of the overall AI market.
A credible cross-provider token-usage comparison would need comparable figures covering the same period, token categories, products, and measurement methods. Without those figures, a definitive global token-usage ranking cannot be established from the public information cited here.
3. Grok’s AI Chatbot Market Share in 2026
Market share is another frequently misunderstood metric. In AI reporting, it can refer to website traffic, app usage, active users, paid subscriptions, API consumption, revenue, or the proportion of a defined market served by a provider.
Those measurements produce different results.
1. Grok’s share of standalone chatbot website visits
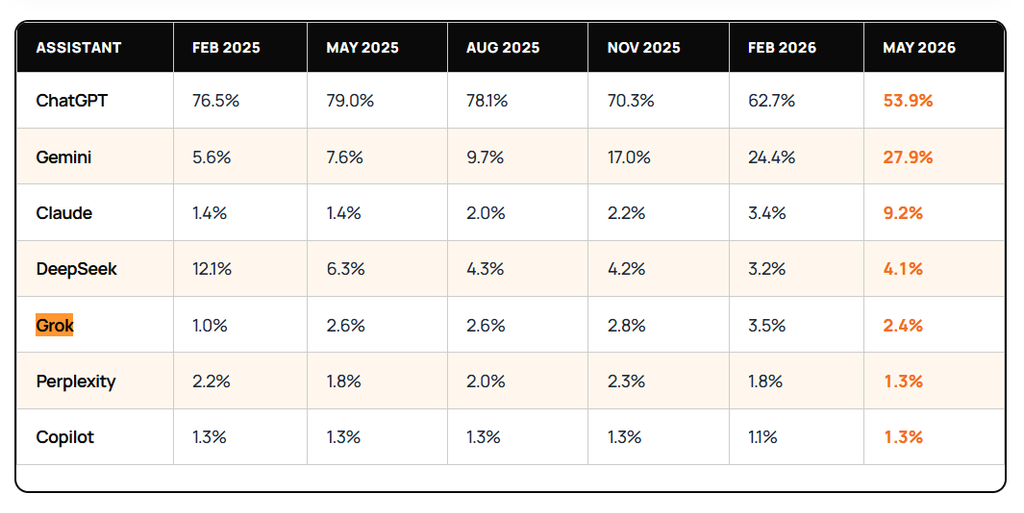
A third-party report citing Similarweb data placed Grok at approximately 2.4% of worldwide standalone AI chatbot website visits in August 2026. In the same snapshot, ChatGPT accounted for 55.5%, Google Gemini 25.6%, and Claude 9.3%. DeepSeek was at 3.4%.
Data period: August 2026. These figures represent a defined set of standalone chatbot websites, not all AI usage worldwide. The source's reported figures do not sum to exactly 100%, reflecting the broader tracked set and rounding.
The figures suggest that Grok was a smaller player than ChatGPT, Gemini, and Claude in this particular web-traffic comparison. They do not show that only 2.4% of AI users use Grok, or that Grok processes 2.4% of global AI tokens.
The distinction is especially important because Grok is integrated with X as well as being available through its own product experiences. Activity inside an app or platform may not appear as a visit to a standalone chatbot website.
2. How has Grok’s market share changed?
A May 2026 comparison published by Momentic using Similarweb data put Grok at 2.4% of the seven assistants’ combined web visits, down 0.4 percentage points year over year. The same report estimated 244.9 million Grok web visits for May 2026.
That gives a more nuanced picture than simply saying Grok is growing or declining. A product can receive more visits in absolute terms while losing share if competing services grow faster. Conversely, a rise in share does not necessarily mean the number of users has increased by the same percentage.
The May and August figures are separate monthly snapshots. They should not be treated as a continuous trend line unless the underlying data definitions and tracked services are consistent.
3. What about Grok users inside X?
Standalone website traffic is not the only way to measure adoption.
A SpaceX filing submitted in 2026 reported approximately 117 million monthly active users of Grok AI features as of March 31, 2026, within the company’s broader X ecosystem.
This is a different measure from Similarweb’s website-visit share. Monthly active users count people using a feature during a specified period, while website visits count browsing sessions or visits as defined by the analytics provider.
The 117 million figure also should not be interpreted as the number of paying SuperGrok subscribers, API customers, or unique users of the standalone Grok website. It refers specifically to use of Grok AI features within the reported X context.
4. Token Usage, Leaderboard Position and Market Share: What’s the Difference?
The three metrics can move independently. Understanding what each one measures is essential before drawing conclusions about Grok’s competitive position.
| Metric | What it measures | What it cannot prove by itself |
|---|---|---|
| Arena leaderboard rank | Relative performance under a particular human-preference evaluation | Total users, revenue, or global token volume |
| Token consumption | Tokens processed within a specified account, model, or reporting scope | Market share across all AI providers |
| Website-visit share | A product’s proportion of visits within a defined traffic sample | Total app usage, API activity, or unique users |
| Monthly active users | Users active within a stated period and product scope | Number of paid customers or intensity of use |
| API spending | Amount charged for API consumption | Number of users or tokens unless usage data is also available |
For example, a model could rank highly on Arena but have a smaller user base because it is new, expensive, or less widely distributed.
Another assistant could have a lower benchmark score but receive more usage through a widely adopted platform.
Likewise, high token volume may indicate that a model is processing long documents or generating lengthy outputs. It does not automatically indicate superior answer quality or more individual users.
A sound assessment of Grok should combine these metrics while keeping their definitions separate.
5. What Do Grok’s Rankings Mean for Developers and Businesses?
For developers and businesses choosing an AI model, rankings are useful as a starting point. They should not replace testing on the actual workload.
1. Choose models based on the task
A practical evaluation process is to:
- For coding: Compare coding-specific benchmark results and test the model against your own repository or programming tasks.
- For research: Evaluate factual accuracy, source quality, and how well the model handles current information when appropriate tools are enabled.
- For customer support: Test consistency, instruction following, response quality, and how the model handles unclear requests.
- For large-scale API use: Measure token consumption, latency, reliability, and cost per successfully completed task.
- For multimodal work: Use evaluations relevant to image, video, or audio capabilities rather than relying only on text rankings.
The most useful metric may be cost per successful task, not cost per token alone. A cheaper model can become more expensive in practice if it requires repeated prompts, human correction, or extra tool calls.
2. Track tokens before scaling an application
xAI’s Usage Explorer and cost-tracking documentation can help API customers monitor usage and actual request costs. The cost-tracking documentation explains that API responses include a cost_in_usd_ticks field in the usage object for supported requests.
A basic monitoring routine should track:
- Input and output token volume.
- Cost by model and API key.
- Cost per completed task.
- Changes in usage after a prompt or model update.
- Unusual spikes that may indicate a loop, an inefficient prompt, or unexpected traffic.
This is more actionable than comparing a company’s internal token count with an unsupported estimate of global Grok usage.
6. What Could Change Grok’s Position Next?
Grok’s future position will depend on several factors, including model quality, product distribution, price, reliability, and the usefulness of its tools.
1. Model improvements and specialized variants
xAI continues to develop the Grok model family. Its July 2026 announcement of Grok 4.5 emphasized coding, agentic tasks, and knowledge work.
Newer variants can change leaderboard performance, but the impact should be measured using the exact model identifier and evaluation date. A new release does not guarantee an immediate improvement in every leaderboard category.
2. Distribution through X
Integration with X gives Grok a route to users beyond those who visit a standalone AI website. This can influence adoption, but it also makes simple website-traffic comparisons incomplete.
The best way to assess this advantage is to keep separate measures for website visits, in-platform activity, active users, subscriptions, and API consumption.
3. Pricing and token efficiency
For API customers, token costs can influence whether a model is practical for production. Efficient prompts, caching where applicable, appropriate model selection, and shorter outputs can reduce spending without necessarily reducing usefulness.
However, a lower cost per token is not the same as a lower total cost. Businesses need to consider how many tokens are used, how many requests succeed, and how much additional processing or human review is required.
4. Trust, reliability, and transparency
Long-term adoption also depends on factual accuracy, dependable service, clear usage limits, and transparent reporting. Leaderboards can indicate how users prefer model responses, but they do not capture every operational or business requirement.
For Grok, continued progress will be easier to evaluate when model-specific benchmarks, product adoption figures, and usage statistics are reported with clear definitions and comparable time periods.
Final Thoughts
The Grok rankings update for October 2026 shows why AI performance, token usage, and market share need to be evaluated separately. Arena’s October 8 snapshot places Grok 4.20 beta1 at rank 37 in overall text evaluations, while third-party analytics estimate Grok’s share of standalone chatbot website visits at 2.4% in August.
xAI provides developers with tools to monitor their own token consumption, but that is not the same as a public, provider-wide token-usage leaderboard. Company-reported adoption figures offer another perspective, particularly because Grok is integrated into X.
For users and businesses, the most reliable approach is to combine dated leaderboard results, clearly defined usage statistics, and workload-specific testing.
That gives a more accurate view of Grok’s competitive position than any single ranking or market-share figure.
Frequently Asked Questions
1. What is the latest Grok ranking in 2026?
On Arena’s October 8, 2026, text leaderboard snapshot, Grok 4.20 beta1 was ranked 37th with a score of 1475 ± 5. Rankings change over time and differ by task category, so check the live Arena leaderboard for the current position.
2. How much token usage does Grok have?
There is no verified public figure cited here for the total number of tokens processed across all Grok products worldwide. xAI’s Usage Explorer lets customers inspect their own API token consumption by model and other dimensions.
3. What is Grok’s AI chatbot market share?
A Similarweb-based report put Grok at 2.4% of worldwide standalone AI chatbot website visits in August 2026. This is a share of tracked web visits, not a share of all AI users, revenue, API calls, or tokens.
4. Does a higher Grok leaderboard rank mean more users?
No. Leaderboards measure performance under a specific evaluation method. User adoption depends on additional factors, including distribution, price, availability, and product usefulness.
5. Can I compare Grok token usage directly with ChatGPT token usage?
Not reliably without comparable data from both providers. The providers would need to report token counts using compatible definitions, product scopes, and time periods. An account’s API usage cannot establish the providers’ global market shares.
6. Where can I check Grok API usage and cost?
Use the xAI Console Usage Explorer to review token consumption and cost for your account. For per-request cost details, consult the xAI cost-tracking documentation.
Also Read –
Grok AI Models: Ultimate Comparison Every Model Explained